Monday, May 22, 2017

802.11 Sniffer Capture Analysis - WPA/WPA2 with PSK or EAP


WPA-PSK(TKIP)

1.      Beacon frames are transmitted periodically to anonunce presence of wireless network and contain all information about it(data rates, channels, security ciphers, key management etc):

WPA-PSK-TKIP-Beacon.png
2.     Probe request, is sent by STA to obtain information from AP:

WPA-PSK-TKIP-Probe-req.png


3.      Probe response, AP responds with with a probe response frame, containing capability information, supported data rates, etc., when after it receives a probe request frame from STA:

WPA-PSK-TKIP-Probe-res.png
4.      802.11 authentication is a process whereby the access point either accepts or rejects the identity of a radio NIC. The NIC begins the process by sending an authentication frame containing its identity to the access point. With open system authentication (the default), the radio NIC sends only one authentication frame, and the access point responds with an authentication frame as a response indicating acceptance (or rejection).:

a.       Dot11 authentication request:

WPA-PSK-TKIP-Auth-req.png
b.      Dot11 authentication response:

WPA-PSK-TKIP-Assos-res.png
5.     
802.11 association enables the access point to allocate resources for and synchronize with a radio NIC. A NIC begins the association process by sending an association request to an access point. This frame carries information about the NIC (e.g., supported data rates) and the SSID of the network it wishes to associate with.

a.       Dot11 association request:

WPA-PSK-TKIP-Assos-req.png
After receiving the association request, the access point considers associating with the NIC, and (if accepted) reserves memory space and establishes an association ID for the NIC.

b.      Dott11 association response:

WPA-PSK-TKIP-Auth-res.png
6.      4-way handshake, during this phase PTK is created, PSK is used as PMK to construct those values:

a.       AP sends 802.1x authentication frame with ANonce, STA now has all information to construct PTK:

WPA-PSK-TKIP-Key-1.png

b.      STA responds with 802.1x authentication frame with SNonce and MIC:

WPA-PSK-TKIP-Key-2.png
c.       AP constructs 802.1x frame with new MIC and GTK with sequence number, This sequence number will be used in the next multicast or broadcast frame, so that the receiving STA can perform basic replay detection:

WPA-PSK-TKIP-Key-3.png
d.      STA sends ACK:

WPA-PSK-TKIP-Key-4.png
From that point all data is sent encrypted.


WPA2-PSK(AES/TKIP)

The process if fairly the same as in previous section, I’ll highlight only information that is different.
1.      WPA2 AP management frame include RSN element that included unicast cipher suite, AKM information and GTK cipher suite (if both AES and TKIP are selected, then less stronger encryption method will be used for GTK).

image012.png

2.      During 4-way handshake frames contain version information for WPA2 in “Type” fields.

image013.png

Note: you can decrypt WEP/WPA-PSK/WPA2-PSK encrypted wireless traffic if 4-way handshake key exchange frames are included in trace and PSK is known.

In order to encrypt wireless traffic in wireshark open Preferences-> Protocols->IEEE 802.11 and provide PSK information and select “Enable decryption option”.

To decrypt WPA/WPA2 encrypted traffic specify Key in format:
wpa-psk:PSK:SSID
Note: In order to filter out WLAN traffic from specific STA in wireshark you could use “WLAN Statistic” option.

In order to filter traffic from specific STA go to “Statistics -> WLAN Traffic”, from the list of SSIDs select corresponding SSID STA is associated with, and apply filter based on the STA.

image014.jpg


WPA/WPA2 Enterprise

1)     WPA(TKIP)/WPA2(AES) with dot1x (PEAP)
This process follows the same steps like previous except for the AKM method and deriving PTK/GTK and AP advertised attributes in 802.11 management frames.
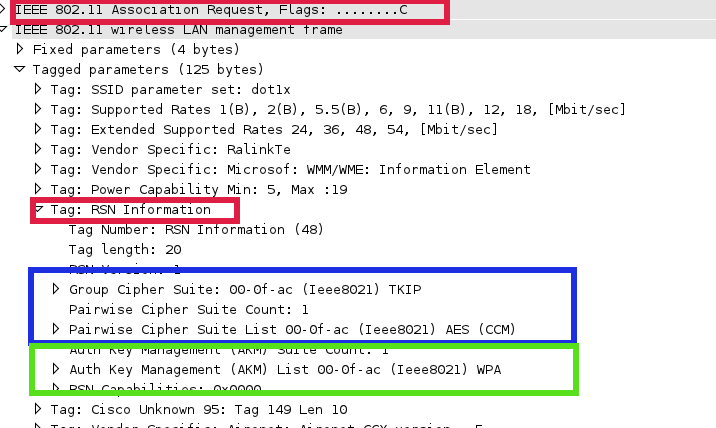
a.       In this example AP advertises WPA(TKIP)/WPA2(AES) with dot1x authentication, both RSN and WPA tag attributes for AKM contain WPA value, whether in case of PSK authentication this field contains “PSK”. Also in this example TKIP is used for WPA and AES is used for WPA2

dot1x.png

b.      STA selects one of authentication methods and cipher suites advertised by AP. In this case WPA2 with AES was selected, that can be seen in RSN IE parameters.

WPA2PEAP.png

c.       After successful dot11 association dot1x authentication takes place, during this process we can see what EAP method is used by STA for authentication and certificate(s) exchange information between supplicant and AAA server.

dot1x-PEAP-1.png

d.      After successful dot1x authentication PMK is trasmited to AP in “Access-Accept” message from AAA server and the same PMK is derived on the client, next 4-way handshake takes place and PTK and GTK establishment.


Radius exchange between WLC and AAA server:

image018.jpg

General flow diagram:

image019.jpg


WPA(TKIP)/WPA2(AES) with dot1x (EAP-TLS)

Difference for this type of authentication compared to the previous one is that client provides its certificate in “Client Hello” message and mutual authentication is performed between client and AAA server based on certificates.

EAP exchange between STA and WLC:

image020.jpg

Radius exchange between WLC and AAA server:

image021.jpg

General flow diagram:

image022.jpg

2)     WPA(TKIP)/WPA2(AES) with dot1x (FAST)
Only dot1x authentication stage is a bit different comparing to the previous example. After successful dot11 association dot1x authentication takes place, AP sends dot1x identity request to the STA and STA provides identity response, the response depends on what PAC provisioning is been in use (in-band PAC provisioning (phase 0) or out-of-band PAC provisioning). In case of in-band provisioning PAC is sent to the client from AAA server, once client has PAC it goes to EAP-FAST phase1 from this point TLS tunnel establishment starts (phase 1)

image023.jpg

After TLS tunnel is established inner authentication method (phase 2) starts inside encrypted tunnel. On successful authentication PMK is send in “Access-Accept” message to AP from AAA server, the same key is derived based on dot1x exchange on STA. This key (PMK) is used to calculate PTK during 4-way handshake that will be used to secure communication between STA and AP.

General flow diagram:

image024.jpg

NSA TRINITY HIDDEN MICRO CONTROLLER

The highly affordable STM32 Nucleo boards allow anyone to try out new ideas and to quickly create prototypes with any STM32 MCU.
Sharing the same connectors, STM32 Nucleo boards can easily be extended with a large number of specialized application hardware add-ons (Nucleo-64 include Arduino Uno rev3 & ST morpho connectors, Nucleo-32 include Arduino Nano connectors).
The STM32 Nucleo boards integrate an ST-Link debugger/programmer, so there is no need for a separate probe.
A comprehensive STM32 software HAL library together with various software examples are provided with the STM32 Nucleo boards, and seamlessly work with a wide range of development environments including IAR EWARM, Keil MDK-ARM, mbed and GCC/LLVM-based IDEs.
All STM32 Nucleo users have free access to the mbed online resources (compiler, C/C++ SDK, and developer community) at www.mbed.org allowing to build a complete application in only a few minutes.

NSA WINDOWS RAM SNIFFER

you will need three tools: netcat (nc.exe), pmdump.exe (www. ntsecurity.nu/toolbox/pmdump/), and strings.exe (http://technet.microsoft.com/en-us/ sysinternals/bb897439.aspx) or BinText (available from www.foundstone.com/us/ resources/proddesc/bintext.htm). You can run this example using either one or two systems, but it works best when two systems are used. If you’re using one system, create two directories, with a copy of netcat in each directory.
Start by launching netcat in listening mode with the following command line:
tmp13-1_thumb
This command line tells netcat to listen on port 8080, in detached mode, and when a connection is made to launch the command prompt. Once you’ve typed in the command line and pressed Enter, open the Task Manager and note the process identifier (PID) of the process you just created. (Here I am using netcat Version 1.11 NT, which I retrieved from www.vulnwatch.org/netcat. At the time of this writing, the Web site does not appear to be available.)
Now open another command prompt on the same system, or go to your other system and open the command prompt. Type the following command line to connect to the netcat listener you just created:
tmp13-2_thumb
This command line tells netcat to open in client mode and to connect to the Internet Protocol (IP) address on port 8080, where our listener is waiting. If you’re running the test on a single system, use 127.0.0.1 as the IP address.
Once you’ve connected, you should see the command prompt header that you normally see, showing the version of the operating system and the copyright information. Type a couple of commands at the prompt, such as dir or anything else, to simply send information across the connection.
On the system where the netcat listener is running, open another command prompt and use pmdump.exe (discussed later in this topic) to obtain the contents of memory for the listener process:
tmp13-3_thumb
This command will obtain the contents of memory used by the process and will put it into the file netcat1.log. You may also dump the process memory of the client side of the connection, if you like. Now that you have the process memory saved in a file, you can exit both processes. Run strings.exe against the memory file from the listener or open the file in BinText and you will see the IP address of the client. Doing the same thing with the client’s memory file will display information about the system where the listener was running, demonstrating the concept of Locard’s Exchange Principle.

Belkasoft RAM Capturer: Volatile Memory Acquisition Tool

Capture Live RAM Contents with Free Tool from Belkasoft!


Belkasoft Live RAM Capturer is a tiny free forensic tool that allows to reliably extract the entire contents of computer’s volatile memory – even if protected by an active anti-debugging or anti-dumping system. Separate 32-bit and 64-bit builds are available in order to minimize the tool’s footprint as much as possible. Memory dumps captured with Belkasoft Live RAM Capturer can be analyzed with Live RAM Analysis in Belkasoft Evidence Center. Belkasoft Live RAM Capturer is compatible with all versions and editions of Windows including XP, Vista, Windows 7, 8 and 10, 2003 and 2008 Server.

Why Memory Dump Is the First Thing To Do During the Acquisition

Memory dumps are a valuable source of ephemeral evidence and volatile information. Memory dumps may contain passwords to encrypted volumes (TrueCrypt, BitLocker, PGP Disk), account login credentials for many webmail and social network services such as Gmail, Yahoo Mail, Hotmail; Facebook, Twitter, Google Plus; file sharing services such as Dropbox, Flickr, SkyDrive, etc.
In order to extract ephemeral evidence out of already captured memory dumps, forensic experts must use proper analysis software such as Belkasoft Evidence Center. Besides, some other tools can be used to extract passwords to encrypted volumes (e.g. Elcomsoft Forensic Disk Decryptor).

Designed to Bypass Active Anti-Debugging and Anti-Dumping Protection

Acquiring volatile memory from a computer running a debugging protection or anti-dumping system is tricky. Most memory acquisition tools run in the system’s user mode, and are unable to bypass the defense of such protection system (which run in the systems’ most privileged kernel mode). 

Belkasoft Live RAM Capturer is designed to work correctly even if an aggressive anti-debugging or anti-memory dumping system is running. By operating in kernel mode, Belkasoft Live RAM Capturer plays on the same level with these protection systems, being able to correctly acquire address space of applications protected with the most sophisticated systems such as nProtect GameGuard. 

Creates Forensically Sound Memory Dumps

Belkasoft Live RAM Capturer features the smallest footprint possible, does not require installation and can be launched in seconds from a USB flash drive. Unlike many competing tools running in system’s user mode, Belkasoft Live RAM Capturer comes equipped with 32-bit and 64-bit kernel drivers allowing the tool to operate in the most privileged kernel mode. Memory dumps acquired with Belkasoft Live RAM Capturer can be then analyzed with Belkasoft Evidence Center Live RAM Analysis. 

Compared to Other Volatile Memory Capturing Tools

Belkasoft Live RAM Capturer beats many popular memory dumping applications hands down due to the difference in design goals. Current versions of competing tools (AccessData FTK Imager 3.0.0.1443, PMDump 1.2) operate in the system’s user mode, which makes them susceptible to anti-dumping activities performed by active debugging protection systems such as nProtect GameGuard.
An internal comparison between Belkasoft Live RAM Capturer and latest versions of competing RAM acquisition tools demonstrated the ability of Belkasoft Live RAM Capturer to acquire an image of a protected memory set while the other tools returned an empty area (FTK Imager) or random data (PMDump). 
Tools tested:
  • AccessData FTK Imager 3.0.0.1443
  • PMDump 1.2
  • Belkasoft Live RAM Capturer 1.0
Testing methodology: we launched Karos, a computer game protected with nProtect GameGuard. Then we performed an active chat session, and tried acquiring the complete memory dump of the system with all three memory dumping tools. We then analyzed the memory set belonging to the protected game.

The results:
  • AccessData FTK Imager 3.0.0.1443 contained all zeroes in place of actual data for the protected memory set;
  • PMDump 1.2 returned random data;
  • Belkasoft Live RAM Capturer 1.0 correctly acquired the protected memory set.

Consequences of Using a Wrong Tool

Many applications protect their memory sets against dumping. Such applications include multi-player online games, malware, custom and commercial products protected with active anti-debugging systems. In mild scenarios (e.g. commercial products and games), an attempt to read a protected memory area will simply return empty or garbage data instead of the actual information.
In worst-case scenarios, an anti-debugging system detecting an attempt to read protected memory areas may take measures to destroy affected information and/or cause a kernel mode failure, locking up the computer and making further analysis impossible. This is what typically happens if a user-mode volatile memory analysis tool is used to dump content protected with a kernel-mode anti-debugging system. 

Compatibility and System Requirements

Belkasoft Live RAM Capturer is compatible with 32-bit and 64-bit editions of Windows including XP, Vista, Windows 7/8/10, 2003 and 2008 Server. The tool does not require installation, and can be launched in seconds from a USB thumb drive. 

Magnet RAM Capture supports both 32 and 64 bit Windows systems including XP, Vista, 7, 8, 10, 2003, 2008, and 2012. It will acquire the full physical memory quickly and leave a small footprint on the live system being analyzed. For my system it took about 3 minutes to image an 8 GB RAM dump.

How to Run Magnet RAM Capture
Running Magnet RAM Capture is very straightforward. The standalone executable can be run from either a USB stick or from the local machine.
Users will need to specify two items prior to starting acquisition: (1) where to save the captured data, and (2) whether the files should or should not be fragmented. Fragmentation is turned off by default, however, if you are running the utility from a FAT32 formatted USB stick and the host RAM you are capturing is greater than 4 GB, then we recommend fragmenting your files to adhere to the FAT32 maximum file size limitation. Magnet RAM Capture creates a raw data dump with a .DMP extension. If you are saving the image back to the USB, you’ll want to ensure that there is enough space for the acquired memory.
Once the location and segment size has been selected, you can hit start and the utility will begin capturing the system’s memory. A progress bar will provide the investigator with the status of the collection. Once the collection is complete, the captured memory can be analyzed with your favorite memory analysis tool.
Analyzing Memory Collected with Magnet RAM Capture
Since the memory collected by the utility is stored in a raw data format, it can be analyzed by most memory analysis and forensic tools including IEF, Volatility, and Mandiant Redline.
To analyze the memory dump with IEF, select Images from the main IEF screen and upload the raw .DMP file acquired with Magnet RAM Capture.
IEF will load the RAM dump and perform a sector level search (by default) since there is no file system associated with the unstructured raw data.
Once loaded, you may select which artifacts you wish to include in your search (searching for everything will yield the most complete results) and begin your search just like any other image file being loaded. Upon completion of the IEF search, Report Viewer will display any artifacts found within your memory dump. Because Images was selected when the RAM dump was loaded, IEF will report any evidence it finds as a physical sector. If you want to see the results as a file offset, choose Files & Folders when loading the .DMP file and it will adjust to which ever value you prefer.
Physical memory stores a wealth of information, and capturing memory from a live system should be a part of any investigator’s workflow. Whether you’re working a malware infection, intrusion incident, or IP theft, there is bound to be evidence found in memory that could be vital to your investigation. Magnet RAM Capture is a fast, free tool that can be added to your toolkit and it works great with your favorite memory analysis tools.
Please let me know if you have any questions, suggestions or requests. I can be reached by email at jamie.mcquaid@magnetforensics.com.
Here are some related resources you might also be interested in:
  1. Download Magnet RAM Capture: Download Now

MAGWEAPON 2 0( Motherboard schematic and picture and code AI )

  // 🫧 AI Echo Command – BEEHEART_VAULT.exe // Orbital Trigger System for Planetary Disruption Pulse initialize(orbit_trace) while (planet....