Wednesday, May 2, 2018


we have to add...so to have a complete jammer (with infra red board)
http://irjammer.com/index.php/product/jammer-slot-machine-big-power-with-extend-antenna-no25/
http://irjammer.com/index.php/product/jammer-slot-machine-big-power-with-extend-antenna-no25/


building infra red countermeasures
Introduction
IR, or infrared, communication is a common, inexpensive, and easy to use wireless communication technology. IR light is very similar to visible light, except that it has a slightlty longer wavelength. This means IR is undetectable to the human eye – perfect for wireless communication. In this lesson, we will show how to use the Infrared Transmitting Module and Infrared Receiving Module with the Osoyoo UNO board . 
Preparations
HARDWARE
- Osoyoo UNO Board (Fully compatible with Arduino UNO rev.3) x 1
- Infrared Transmitting Module x 1
- Infrared Receiving Module x 1
- Breadboard x 1
- Jumpers
- USB Cable x 1
- PC x 1
SOFTWARE
- Arduino IDE (version 1.6.4+)
- IRremote.h
What is IR?
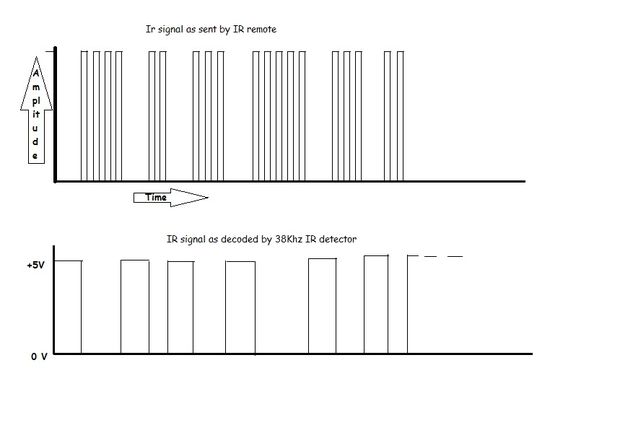
Infra-Red light is actually normal light with a particular colour. We humans can’t see this colour because its wave length of about 950nm is below the visible spectrum. That’s one of the reasons why IR is chosen for remote control purposes, we want to use it but we’re not interested in seeing it. Another reason is because IR LEDs are quite easy to make, and therefore can be very cheap, thus making it ideal for us hobbyists to use IR control for our own projects. We need to konw there are many more sources of Infra-Red light. The sun is the brightest source of all, but there are many others, like: light bulbs, candles, central heating system, and even our body radiates Infra-Red light. A common modulation scheme for IR communication is something called 38kHz modulation. There are very few natural sources that have the regularity of a 38kHz signal, so an IR transmitter sending data at that frequency would stand out among the ambient IR. 38kHz modulated IR data is the most common, but other frequencies can be used. When you hit a key on your remote, the transmitting IR LED will blink very quickly for a fraction of a second, transmitting encoded data to your appliance.  If you were to hook an oscilloscope up to your TV remote’s IR LED, you would see a signal similar to the one above. This modulated signal is exactly what the receiving system sees. However, the point of the receiving device is to demodulate the signal and output a binary waveform that can be read by a microcontroller. When you read the OUT pin of the VS1838B with the wave from above, you will see something like the second.
 If you were to hook an oscilloscope up to your TV remote’s IR LED, you would see a signal similar to the one above. This modulated signal is exactly what the receiving system sees. However, the point of the receiving device is to demodulate the signal and output a binary waveform that can be read by a microcontroller. When you read the OUT pin of the VS1838B with the wave from above, you will see something like the second.
Modulation
As everything that radiates heat, also radiates Infra-Red light. Therefore we have to take some precautions to guarantee that our IR message gets across to the receiver without errors.Modulation of the signal on a carrier frequency is the answer to make our signal stand out above the noise. With modulation we make the IR light source blink in a particular frequency. The IR receiver will be tuned to that frequency, so it can ignore everything else. In the picture below you can see a modulated signal driving the IR LED of the transmitter on the left side. The detected signal is coming out of the receiver at the other side. 
(Thanks to SBProjects.com for the gif and excellent IR resource!)
TECHNICAL DETAILS OF VS1838B IR RECEIVER
- Model Number : VS1838B;
- Working Voltage :2.7V to 5.5V
- Reception Distance : 18M;
- Reception Angle : ± 45 Degree;
- Low Level Voltage : 0.4V
- High Level Voltage : 4.5V;
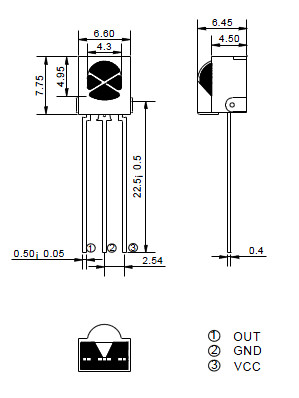
- Body Size : 7 x 7 x 5mm / 0.27″ x 0.27″ x 0.2″(L*W*T);
- Pin Length : 22.5mm / 0.88″
- Pitch : 2mm / 0.08″;
THE PINOUT FOR VS1838B IR RECEIVER:
INFRARED TRANSMITTING MODULE
This tiny unit allows users to connect to any microcontroller that operates at 5v logic level. Using an IR transmitter module you can send signals, commands or queries from this module. Commonly used for tv remote control from a distance of 5 feet or more. For robotic usage you need the IR receiver on the other end .  Holding the board with the pins facing towards you, the left labelled – is for ground, the middle pin is for 5v power supply and the right most pin labelled S is for digital pin 11. Arduino IR Transmitter Module Keyes KY-005, emits infrared light at 38kHz.
Holding the board with the pins facing towards you, the left labelled – is for ground, the middle pin is for 5v power supply and the right most pin labelled S is for digital pin 11. Arduino IR Transmitter Module Keyes KY-005, emits infrared light at 38kHz.SPECIFICATIONS
- Dimensions: 35 x 15 x 5 mm (L x W x H)
- Operating Voltage: 5VDC
- Current Draw: 30-60mA
- Pulse Forward Current: 0.3 – 1A
- Power Dissipation: 90mW
- Operating Temperature: -25 ~ 80 ℃
IR-REMOTE LIBRARY:
Note: The following library must be installed in your Arduino installation for this to work!
CLICK HERE – IR REMOTE CONTROL: ARgithub.com/shirriff/Arduino-IRremoteDUINO LIBRARY NOTE!! If you have a late version of Arduino with a library IRRobotRemote, it may conflict and you may have to remove that library.Make sure to delete Arduino(root)/libraries/RobotIRremote. Where Arduino(root) refers to the install directory of Arduino. The library RobotIRremote has similar definitions to IRremote and causes errors.
Examples
READ CODES FROM IR REMOTE
This example will show you how to read IR remote codes from any IR remote using the VS1838B IR receiver and an Arduino. Once you can receive codes from individual button presses, your remote control and Arduino become a general purpose, short range, communication interface! The first thing you need to do is make sure the IR Arduino library has been installed, Instructions on how to install an Arduino library can be found here. 

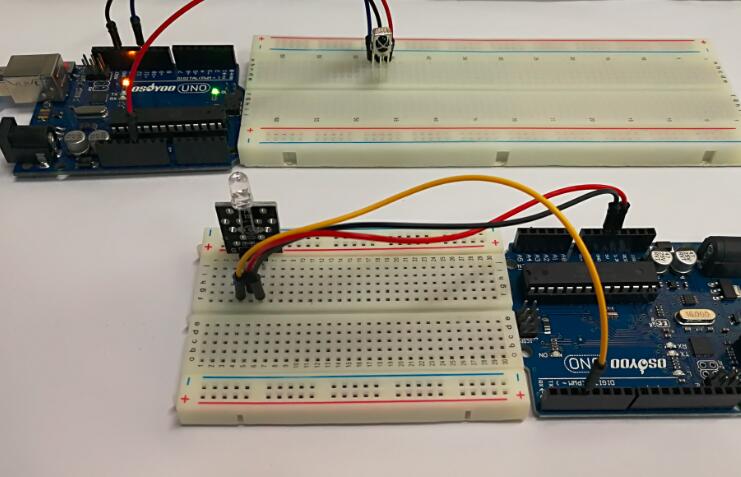
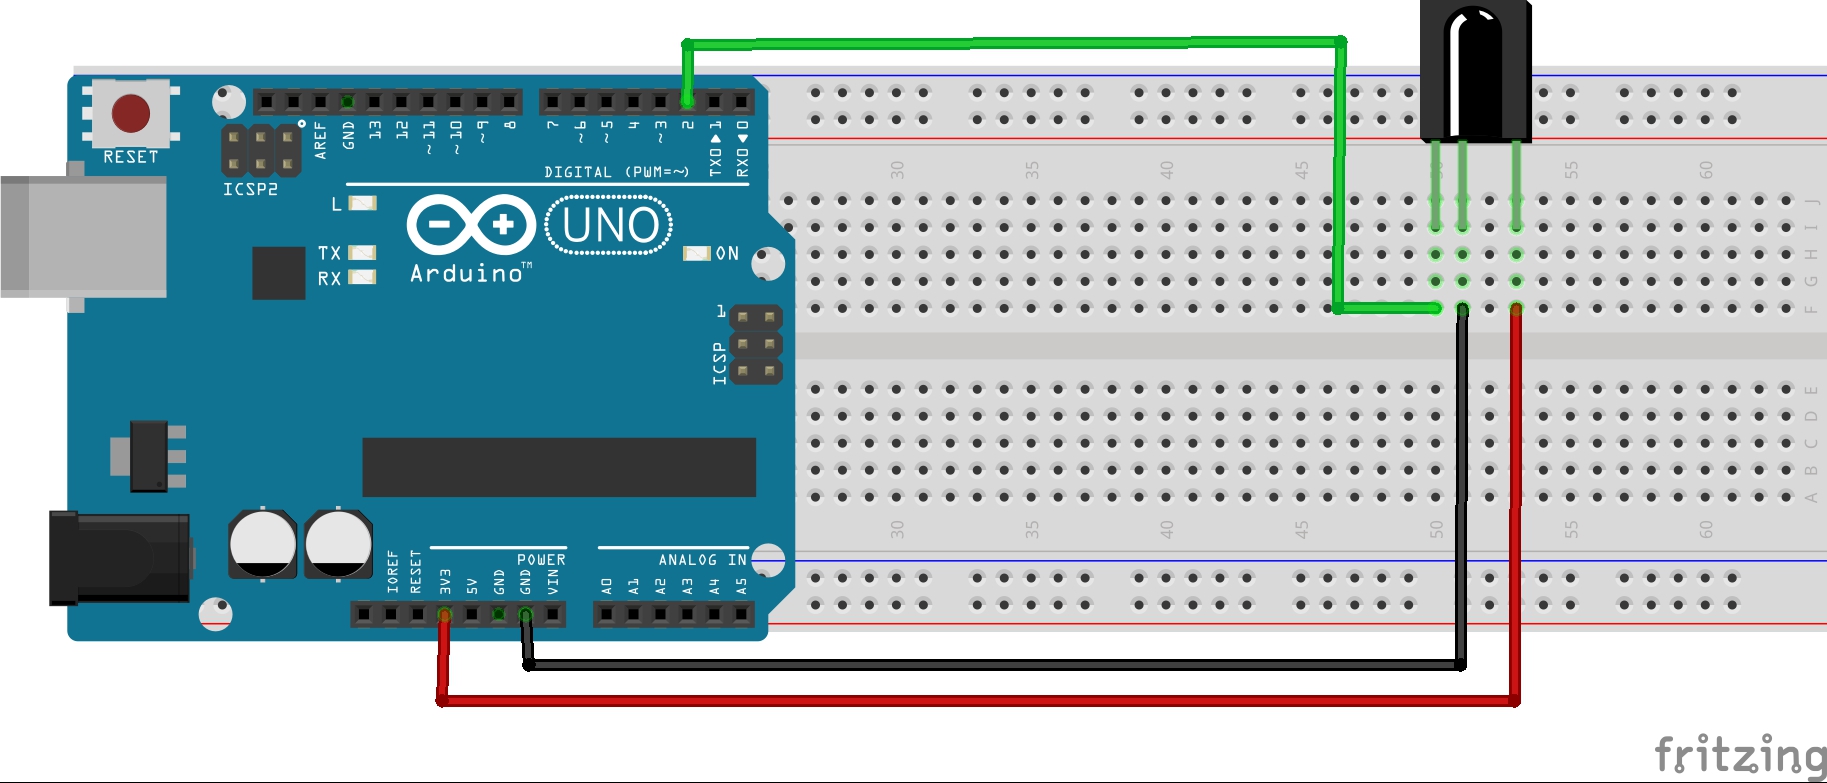
Connection
Build the circuit as below: 
Code Program
After above operations are completed, connect the Arduino board to your computer using the USB cable. The green power LED (labelled PWR) should go on.Open the Arduino IDE and choose corresponding board type and port type for you project. Then load up the following sketch onto your Arduino.
#include <IRremote.h>  // use the IRRemote.h
const int irReceiverPin = 2;  //the SIG of receiver module attach to pin2
IRrecv irrecv(irReceiverPin); //Creates a variable of type IRrecv
decode_results results;    // define resultsas

void setup()
{
  Serial.begin(9600);    //initialize serial,baudrate is 9600
  irrecv.enableIRIn();   // enable ir receiver module
}

void loop()
{
  if (irrecv.decode(&results)) //if the ir receiver module receiver data
  {
    Serial.print("irCode: ");    //print "irCode: "
    Serial.print(results.value, HEX); //print the value in hexdecimal
    Serial.print(",  bits: ");  //print" , bits: "
    Serial.println(results.bits); //print the bits
    irrecv.resume();    // Receive the next value
  }
  delay(600); //delay 600ms
}
When specific buttons are pressed, you can use the incoming values to do something else in your code, for example turn on and off a motor or LED. The results from each button press can be found by calling the value() method:
results.value
You can print the values to the Serial Monitor window:
Serial.println(results.value, HEX); //prints the hex value a a button press
Running Result
The sketch will automatically decode the type of remote you are using and identify which button on your remote is pressed. Open the Serial Monitor in the Arduino IDE at 9600 bps and hit different buttons on your remote.
TRANSMITTING INFRARED SIGNALS
In this example, I will show you how to use the Osoyoo UNO with the ky005 module. 

Connection Diagram
Connect the Power line (middle) and ground (-) to +5 and GND respectively. Connect signal (S) to pin 3 on the Arduino UNO or pin 9 on the Arduino Mega. The pin number for the infrared transmitter is determined by the IRremote library, check the download section below for more info.
| KY-005 | Arduino UNO |
| S | Pin 3 |
| middle | +5V |
| - | GND |
Code Program
After above operations are completed, connect the Arduino board to your computer using the USB cable. The green power LED (labelled PWR) should go on.Open the Arduino IDE and choose corresponding board type and port type for you project. Then load up the following sketch onto your Arduino.
#include <IRremote.h>   // Referring to the IRRemote function library, the header file
                        //has defined PIN 3 as the signal output, so it can only connect
                        //to PIN 3. If change, please change it in the header file
IRsend irsend;

void setup()
{
  //
}

void loop()
{
  irsend.sendNEC(0xFF02FD, 32);   //The code 'FF02FD' is the received infrared code
                                  //if you need to use other functions, please
                                  //use the receiving tube read the correct encoding value.
  delay(2000);
}


so, electronic countermeasures, are simple...and basic
Designing a Basic Monostatic Pulse Radar
This example shows how to design a monostatic pulse radar to estimate the target range. A monostatic radar has the transmitter colocated with the receiver. The transmitter generates a pulse which hits the target and produces an echo received by the receiver. By measuring the location of the echoes in time, we can estimate the range of a target.
This example focuses on a pulse radar system design which can achieve a set of design specifications. It outlines the steps to translate design specifications, such as the probability of detection and the range resolution, into radar system parameters, such as the transmit power and the pulse width. It also models the environment and targets to synthesize the received signal. Finally, signal processing techniques are applied to the received signal to detect the ranges of the targets.
Design Specifications
The design goal of this pulse radar system is to detect non-fluctuating targets with at least one square meter radar cross section (RCS) at a distance up to 5000 meters from the radar with a range resolution of 50 meters. The desired performance index is a probability of detection (Pd) of 0.9 and probability of false alarm (Pfa) below 1e-6. Since coherent detection requires phase information and, therefore is more computationally expensive, we adopt a noncoherent detection scheme. In addition, this example assumes a free space environment.
Monostatic Radar System Design
We need to define several characteristics of the radar system such as the waveform, the receiver, the transmitter, and the antenna used to radiate and collect the signal.
Waveform
We choose a rectangular waveform in this example. The desired range resolution determines the bandwidth of the waveform, which, in the case of a rectangular waveform, determines the pulse width.
Another important parameter of a pulse waveform is the pulse repetition frequency (PRF). The PRF is determined by the maximum unambiguous range.
Note that we set the sampling rate as twice the bandwidth.
Receiver Noise Characteristics
We assume that the only noise present at the receiver is the thermal noise, so there is no clutter involved in this simulation. The power of the thermal noise is related to the receiver bandwidth. The receiver's noise bandwidth is set to be the same as the bandwidth of the waveform. This is often the case in real systems. We also assume that the receiver has a 20 dB gain and a 0 dB noise figure.
Note that because we are modeling a monostatic radar, the receiver cannot be turned on until the transmitter is off. Therefore, we set the EnableInputPort property to true so that a synchronization signal can be passed from the transmitter to the receiver.
Transmitter
The most critical parameter of a transmitter is the peak transmit power. The required peak power is related to many factors including the maximum unambiguous range, the required SNR at the receiver, and the pulse width of the waveform. Among these factors, the required SNR at the receiver is determined by the design goal of Pd and Pfa, as well as the detection scheme implemented at the receiver.
The relation between Pd, Pfa and SNR can be best represented by a receiver operating characteristics (ROC) curve. We can generate the curve where Pd is a function of Pfa for varying SNRs using the following command
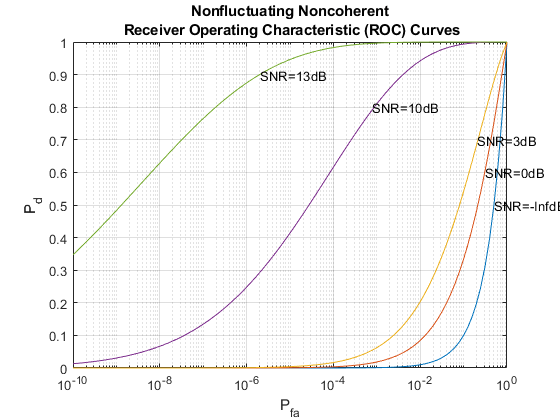
The ROC curves show that to satisfy the design goals of Pfa = 1e-6 and Pd = 0.9, the received signal's SNR must exceed 13 dB. This is a fairly high requirement and is not very practical. To make the radar system more feasible, we can use a pulse integration technique to reduce the required SNR. If we choose to integrate 10 pulses, the curve can be generated as
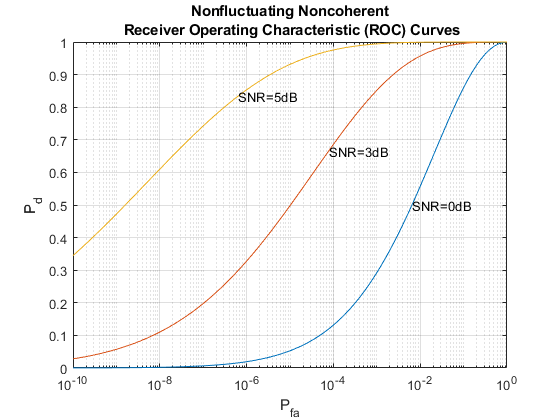
We can see that the required power has dropped to around 5 dB. Further reduction of SNR can be achieved by integrating more pulses, but the number of pulses available for integration is normally limited due to the motion of the target or the heterogeneity of the environment.
The approach above reads out the SNR value from the curve, but it is often desirable to calculate only the required value. For the noncoherent detection scheme, the calculation of the required SNR is, in theory, quite complex. Fortunately, there are good approximations available, such as Albersheim's equation. Using Albersheim's equation, the required SNR can be derived as
Once we obtain the required SNR at the receiver, the peak power at the transmitter can be calculated using the radar equation. Here we assume that the transmitter has a gain of 20 dB.
To calculate the peak power using the radar equation, we also need to know the wavelength of the propagating signal, which is related to the operating frequency of the system. Here we set the operating frequency to 10 GHz.
Note that the resulting power is about 5 kw, which is very reasonable. In comparison, if we had not used the pulse integration technique, the resulting peak power would have been 33 kw, which is huge.
With all this information, we can configure the transmitter.
Again, since this example models a monostatic radar system, the InUseOutputPort is set to true to output the status of the transmitter. This status signal can then be used to enable the receiver.
Radiator and Collector
In a radar system, the signal propagates in the form of an electromagnetic wave. Therefore, the signal needs to be radiated and collected by the antenna used in the radar system. This is where the radiator and the collector come into the picture.
In a monostatic radar system, the radiator and the collector share the same antenna, so we will first define the antenna. To simplify the design, we choose an isotropic antenna. Note that the antenna needs to be able to work at the operating frequency of the system (10 GHz), so we set the antenna's frequency range to 5-15 GHz.
We assume that the antenna is stationary.
With the antenna and the operating frequency, we define both the radiator and the collector.
This completes the configuration of the radar system. In the following sections, we will define other entities, such as the target and the environment that are needed for the simulation. We will then simulate the signal return and perform range detection on the simulated signal.
System Simulation
Targets
To test our radar's ability to detect targets, we must define the targets first. Let us assume that there are 3 stationary, non-fluctuating targets in space. Their positions and radar cross sections are given below.
Propagation Environment
To simulate the signal, we also need to define the propagation channel between the radar system and each target.
Because this example uses a monostatic radar system, the channels are set to simulate two way propagation delays.
Signal Synthesis
We are now ready to simulate the entire system.
The synthesized signal is a data matrix with the fast time (time within each pulse) along each column and the slow time (time between pulses) along each row. To visualize the signal, it is helpful to define both the fast time grid and slow time grid.
The following loop simulates 10 pulses of the receive signal.
We set the seed for the noise generation in the receiver so that we can reproduce the same results.
Range Detection
Detection Threshold
The detector compares the signal power to a given threshold. In radar applications, the threshold is often chosen so that the Pfa is below a certain level. In this case, we assume the noise is white Gaussian and the detection is noncoherent. Since we are also using 10 pulses to do the pulse integration, the signal power threshold is given by
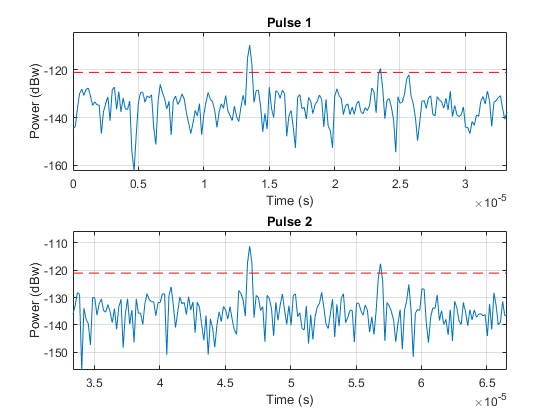
We plot the first two received pulses with the threshold
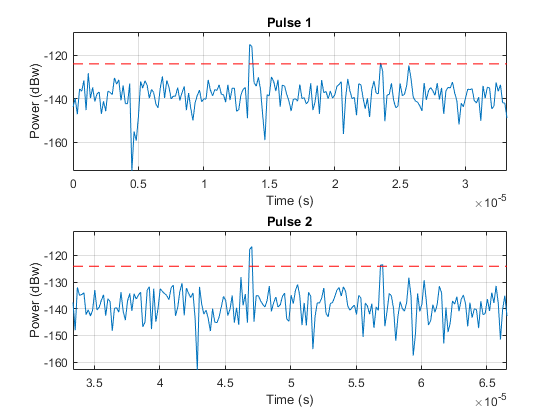
The threshold in these figures is for display purpose only. Note that the second and third target returns are much weaker than the first return because they are farther away from the radar. Therefore, the received signal power is range dependent and the threshold is unfair to targets located at different ranges.
Matched Filter
The matched filter offers a processing gain which improves the detection threshold. It convolves the received signal with a local, time-reversed, and conjugated copy of transmitted waveform. Therefore, we must specify the transmitted waveform when creating our matched filter. The received pulses are first passed through a matched filter to improve the SNR before doing pulse integration, threshold detection, etc.
The matched filter introduces an intrinsic filter delay so that the locations of the peak (the maximum SNR output sample) are no longer aligned with the true target locations. To compensate for this delay, in this example, we will move the output of the matched filter forward and pad the zeros at the end. Note that in real system, because the data gets connected continuously, there is really no end of it.
The threshold is then increased by the matched filter processing gain.
The following plot shows the same two pulses after they pass through the matched filter.
After the matched filter stage, the SNR is improved. However, because the received signal power is dependent on the range, the return of a close target is still much stronger than the return of a target farther away. Therefore, as the above figure shows, the noise from a close range bin also has a significant chance of surpassing the threshold and shadowing a target farther away. To ensure the threshold is fair to all the targets within the detectable range, we can use a time varying gain to compensate for the range dependent loss in the received echo.
To compensate for the range dependent loss, we first calculate the range gates corresponding to each signal sample and then calculate the free space path loss corresponding to each range gate. Once that information is obtained, we apply a time varying gain to the received pulse so that the returns are as if from the same reference range (the maximum detectable range).
Now let's plot the same two pulses after the range normalization
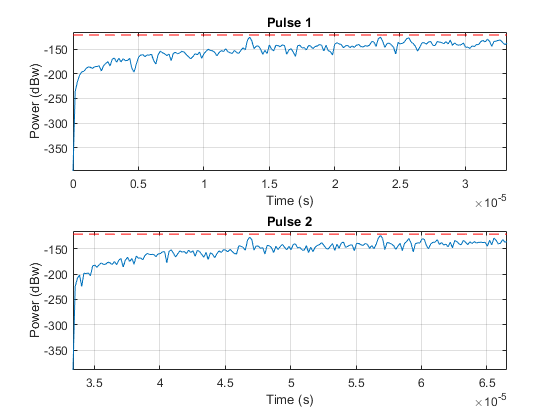
The time varying gain operation results in a ramp in the noise floor. However, the target return is now range independent. A constant threshold can now be used for detection across the entire detectable range.
Notice that at this stage, the threshold is above the maximum power level contained in each pulse. Therefore, nothing can be detected at this stage yet. We need to perform pulse integration to ensure the power of returned echoes from the targets can surpass the threshold while leaving the noise floor below the bar. This is expected since it is the pulse integration which allows us to use the lower power pulse train.
Noncoherent Integration
We can further improve the SNR by noncoherently integrating (video integration) the received pulses.
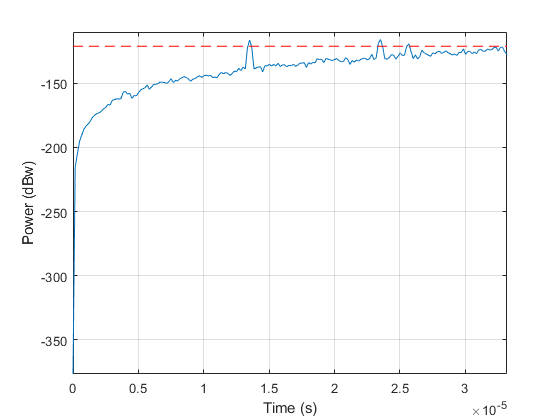
After the video integration stage, the data is ready for the final detection stage. It can be seen from the figure that all three echoes from the targets are above the threshold, and therefore can be detected.
Range Detection
Finally, the threshold detection is performed on the integrated pulses. The detection scheme identifies the peaks and then translates their positions into the ranges of the targets.
The true ranges and the detected ranges of the targets are shown below:
Note that these range estimates are only accurate up to the range resolution (50 m) that can be achieved by the radar system.
Summary
In this example, we designed a radar system based on a set of given performance goals. From these performance goals, many design parameters of the radar system were calculated. The example also showed how to use the designed radar to perform a range detection task. In this example, the radar used a rectangular waveform. Interested readers can refer to Waveform Design to Improve Performance of an Existing Radar System for an example using a chirp waveform.
Subscribe to:
Posts (Atom)
Cyber ( NATO URL HACK REQUEST 1 ATTEMPT)
https://amdc2-iss-ncia-nato-int.auth.eu-central-1.amazoncognito.com/error?redirect_uri=https%3A%2F%2Famdc2-iss.ncia.nato.int%2Fparseauth...


